
Cell polarity refers to the phenomenon in which concentrated molecules in specific parts of cells generate distinct structures. It plays an important role in processes like cell division and movement, and problems with cell polarity have been linked to some diseases.
Currently, scientists use manual methods to study the way cells with polarity behave over time. This process is time-consuming and can be biased, because it has to be executed manually. Ratiometric analysis is a technique that can help correct for uneven distribution of fluorescent markers used to study cells with polarity, but background subtraction techniques are not always accurate.
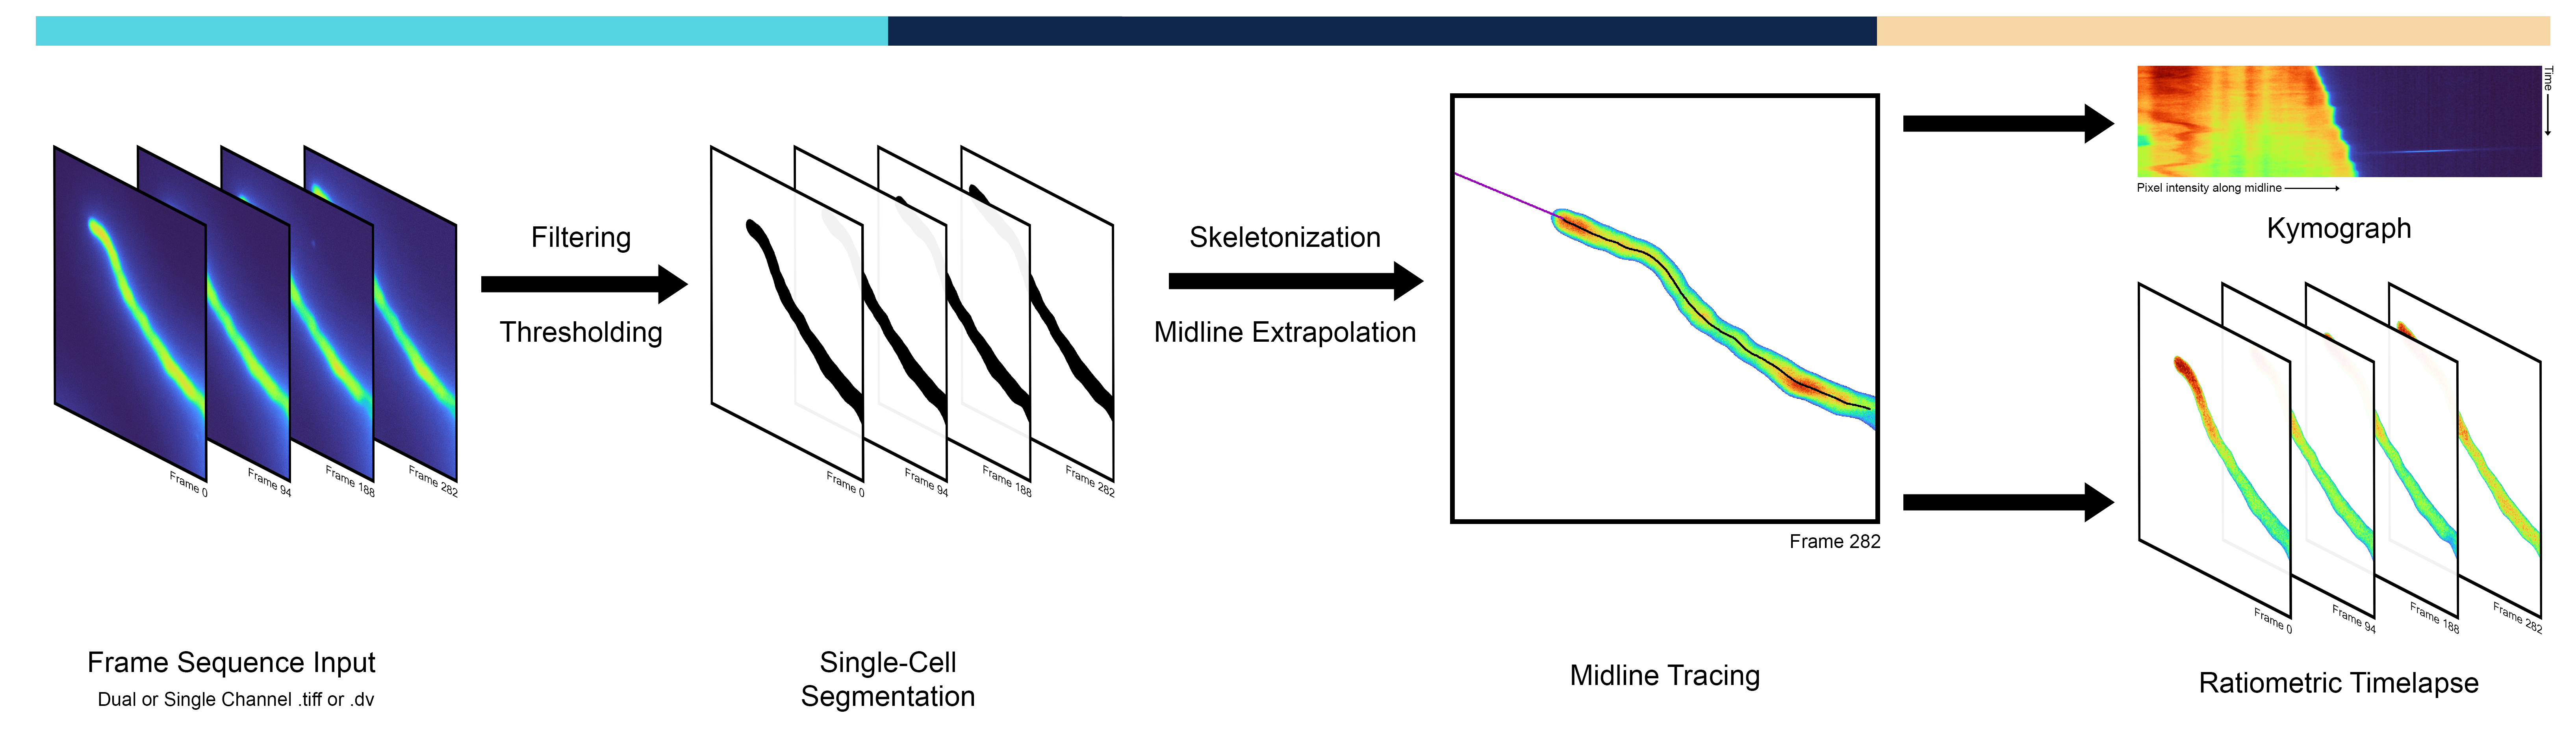
AMEBaS is a new computer program that has been developed to automate the study of cells with polarity and is based in pollen tube growth and ion dynamics data. This program uses a three-step process to analyze fluorescent markers in cells with polarity.
- Single-Cell Segmentation The program separates the cell from the background.
- Midline Tracing It traces a line down the center of the cell and extrapolates it.
- Ratiometric Timelapse It creates a visual representation of the data over time.
This program is faster, less biased, and more accurate than previous methods, making it a useful tool for studying cell polarity.
AMEBaS can be used as a Colab code or as a command line program
AMEBaS Colab features a pre-processed sample data timelapse
usage:
pipeline.py [-h] [--a] [--s [S]] [--f [F]] [--e [E]] [--n [N]] [--v] [--r] [--sm] [--eb] [--o] [--b] [--k [K]] filename
positional arguments:
filename Input timelapse filename. May be a .dv or a .tiff file.
optional arguments:
  -h, --help            show this help message and exit
  --v, --verbose        Outputs internal steps of the pipeline.
  --s [S], --sigma [S]  Sigma used in the Gaussian Filter preprocessing step in preparation to the cell segmentation. Default is 2.
  --a, --complete_skeletonization
                        Traces the midline for each frame of the timelapse. By default, skeletonizes only the last frame.
  --f [F], --interpolation_fraction [F]
                        Fraction of the skeleton used for interpolation. Must be float contained in [0,1]. Default is 0.25.
  --e [E], --extrapolation_length [E]
                        Length in pixels of the extrapolated skeleton. Extrapolates to the edge of the image by default.
  --sf [SF], --shift_fraction [SF]
                        Fraction of the color range that will be shifted to the background in non-extrapolated kymographs. Default is 0.7.
  --k [K], --kymograph_kernel [K]
                        Size of the kernel used in the kymograph Gaussian filtering. Default is 3.
  --eb, --estimate_bg_threshold_intensity
                        Estimates global background threshold intensity via loess polynomial regression of the frame-specific background threshold intensities. Default is false.
  --n [N], --n_points [N]
                        Number of points used in loess smoothing of the background threshold values. Used only with --eb. Default is 40.
  --r, --switch_ratio   Switches channels used as numerator and denominator during ratio calculations. By default the second channel is the numerator and the first is the denominator.
  --sm, --smooth_ratio  Smooths ratiometric output by applying a Median Filter pass. Default is false.
  --o, --reject_outliers
                        During the ratiometric timelapse generation, rejects pixels with abnormal intensities and replaces with the local average. Default is false.
  --b, --background_ratio
                        Export background in the ratiometric output. By default, replaces background with zeros.
Badain, R., Damineli, D. S. C., Portes, M. T., Feijó, J., Buratti, S., Tortora, G., Neves de Oliveira, H., Cesar Jr, R. M. AMEBaS: Automatic Midline Extraction and Background Subtraction of Ratiometric Fluorescence Time-Lapses of Polarized Single Cells. J. Vis. Exp. (196), e64857, doi:10.3791/64857 (2023).
Rafael Badain1, Daniel S. C. Damineli1,2, Maria Teresa Portes3, José Feijó4, Stefano Buratti5, Giorgia Tortora6, Hugo Neves de Oliveira1, Roberto M. Cesar Jr1
1Institute of Mathematics and Statistics, University of São Paulo, Brazil
2Center for Mathematics, Computing and Cognition at the Federal University of the ABC, São Paulo, Brazil
3Department of Botany, Institute of Biosciences, University of São Paulo, Brazil
4Cell Biology and Molecular Genetics Department, University of Maryland, College Park, USA
5Department of Biosciences, University of Milan, 20133 Milano, Italy
6Department of Physics, Politecnico di Milano, 20133 Milano, Italy
This code was tested using the following distributions at time of publication:
mrc==0.3.0
skan==0.11.0
scikit-image==0.19.3
loess==2.1.2
matplotlib==3.7.1
numba==0.56.4
numpy==1.22.4