A web-based package for visualizing persistent homology
####Library Description
VisualizePH is a web-based interactive tool for studying triangle shapes based on persistent homology. The tool is composed of two distinct packages.
######Computing Persistent Homology The first one is a C++ package for computing persistent homology. Given an input triangulation T and a filtering function defined on the vertices of T, the package computes the persistent homology outputting the persistence pairs to be read from the visualization interface. This package is substantially a wrapper of the PHAT library. When no filtering function is defined, the height (z coordinate) of each vertex is used.
######Visualizing Persistence Pairs The second package is a WebGl interactive tool for visualizing persistence pairs.

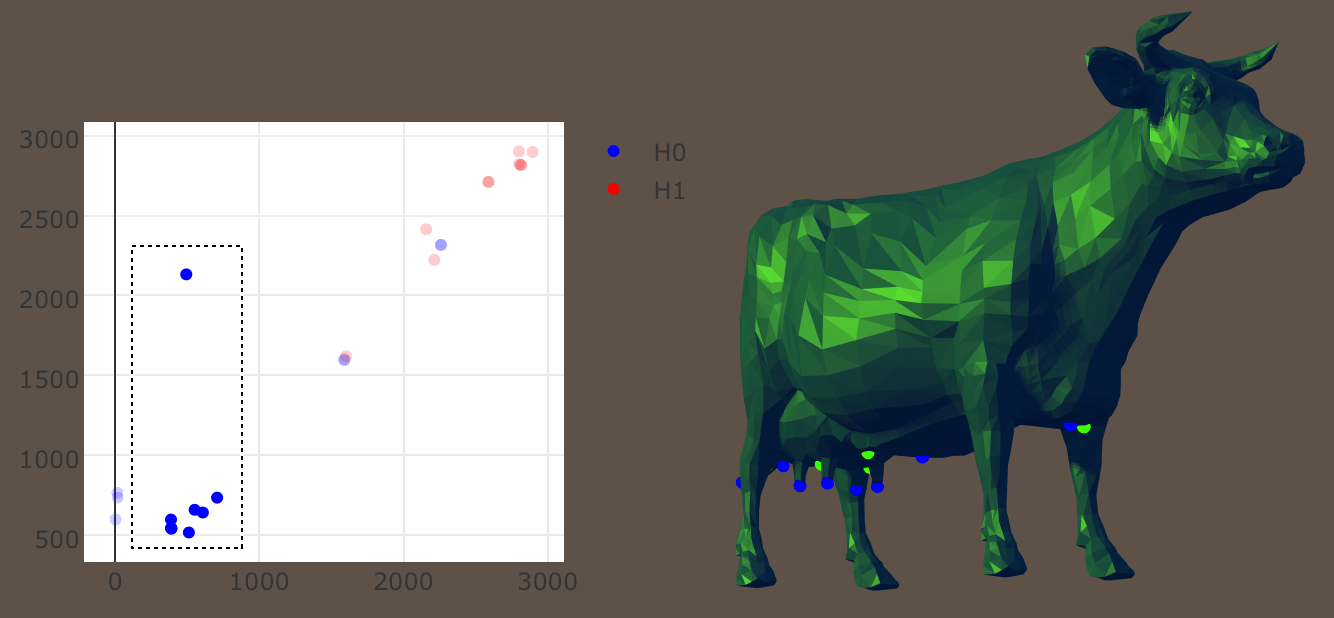
The 3D scene is implemented in THREEJS, a javascript library based on WebGL. Persistence pairs are here depicted as spheres colored according to the simplex dimension (vertices-blue, edges-green, triangles-red). Each sphere is drawn at the barycenter of the corresponding simplex. Interactions with the 3D scene are limited to an orbiting camera allowing to change the point of view.
Near the top-left corner, a scatterplot with all the persistence pairs found on the triangulation is shown. The scatterplot is implemented using Plotly, a high-level charting library built on top of d3js.
Using plotly the user can interactively select subsets of the persistence pairs. We recognize two types of interactions called, scene oblivious and scene modifying.
-
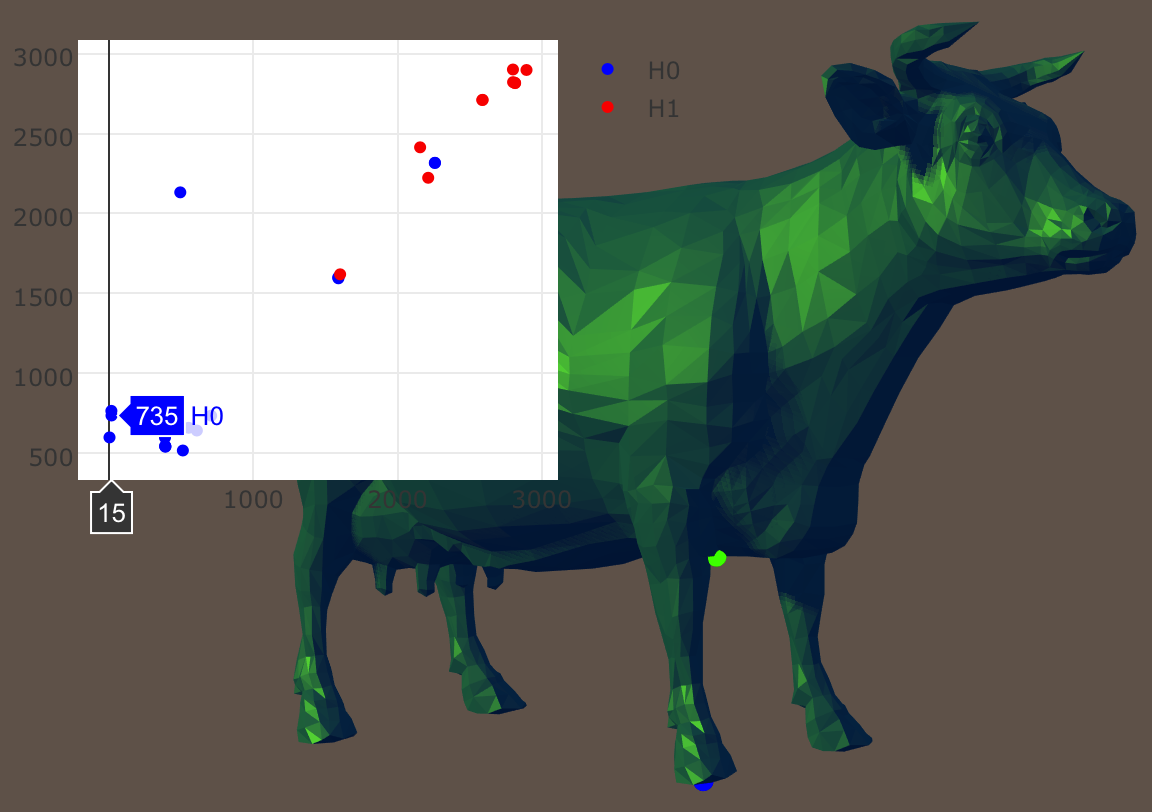
Scene oblivious interactions provoke updates on the scatter plot only. Through such operations, we can zoom in and zoom out on the scatter plot or pan the portion of the graph rendered.
-
Scene modifying interactions change the number of critical pairs visualized in the 3D view and are the main tool for the interactive analysis. Two different tools (box or lazo selection tools) can be used for selecting a subset of points from the graph. Pairs excluded from the selection are also removed from the 3D view of the scene.
####Quick Start
The bash script runViz.sh compiles the C++ package, computes the persistence pairs on the input mesh and sets up the local webserver for running the visualization tool. To use the script type in your terminal
sh runVis.sh [meshFile]
Remember that [meshFile] has to be in .ply format. The main steps taken by the script are:
- compiling the C++ program
g++ -I./source/include/ source/main.cpp -std=c++11 -o computePers
- computing the persistence pairs
./computePers [meshFile]
- setting up a local web server. Using python we can simply use
python -m SimpleHTTPServer 8000
This will serve files from the current directory at localhost under port 8000. Other simple alternatives are discussed here on Stack Overflow.
To see the result open a browser and visit the following link
http://localhost:8000/
#####File Formats ######ASCII .ply
Simple ASCII file containing the explicit representation of vertices and triangles
ply
format ascii 1.0
element vertex 2903                         %number of vertices
property float32 x
property float32 y
property float32 z
element face 5804                           %number of triangles
property list uint8 int32 vertex_indices
end_header
0.605538 0.183122 -0.472278                 %x y z coordinates
0.649223 0.1297 -0.494875
0.601082 0.105512 -0.533343
0.691245 0.0569483 -0.524762
.
.
.
3 0 1 2                                    %number of vertices per face and
3 1 3 4                                    %index of each vertex composing
3 5 6 2                                    %the face
3 6 7 8
3 7 9 10
3 1 0 11
3 9 7 12
3 12 7 6
######.json
JSON file containing the persistence pairs to be visualized
{"pairs": [                                 %two arrays containing for each pair
  {"h0":[368,569,                           %coordinates in the scatterplot
         0.0772813,0.0281013,-0.0100251,    %coordinates of vertex1
         0.0472315,0.00624197,-0.00777435]  %coordinates of vertex2
  },
  {"h1":[1153,1356,
         0.0488116,0.00942118,0.00385671,
         0.0777883,0.0312677,0.00995619,
         1638,1640,
         -0.00850592,0.0874782,0.0400173,
         -0.00703915,0.0241465,0.039699]
 }
]}
####Attribution
If you use our package in your project we encourage you to cite our work. The visualization tool has been published in:
  @article{VisualizePH,
    author       = {U. Fugacci, S. Scaramuccia, F. Iuricich, L. De Floriani},
    title        = {Persistent homology: a step-by-step introduction for newcomers},
    booktitle   = {STAG: Smart Tools and Applications in computer Graphics, to appear.}
    editors      = {Giovanni Pintore and Filippo Stanco}
    month        = September,
    year         = 2016
  }