generated from napi-rs/package-template
-
Notifications
You must be signed in to change notification settings - Fork 6
/
Copy pathREADME.md
251 lines (173 loc) · 7.78 KB
/
README.md
1
2
3
4
5
6
7
8
9
10
11
12
13
14
15
16
17
18
19
20
21
22
23
24
25
26
27
28
29
30
31
32
33
34
35
36
37
38
39
40
41
42
43
44
45
46
47
48
49
50
51
52
53
54
55
56
57
58
59
60
61
62
63
64
65
66
67
68
69
70
71
72
73
74
75
76
77
78
79
80
81
82
83
84
85
86
87
88
89
90
91
92
93
94
95
96
97
98
99
100
101
102
103
104
105
106
107
108
109
110
111
112
113
114
115
116
117
118
119
120
121
122
123
124
125
126
127
128
129
130
131
132
133
134
135
136
137
138
139
140
141
142
143
144
145
146
147
148
149
150
151
152
153
154
155
156
157
158
159
160
161
162
163
164
165
166
167
168
169
170
171
172
173
174
175
176
177
178
179
180
181
182
183
184
185
186
187
188
189
190
191
192
193
194
195
196
197
198
199
200
201
202
203
204
205
206
207
208
209
210
211
212
213
214
215
216
217
218
219
220
221
222
223
224
225
226
227
228
229
230
231
232
233
234
235
236
237
238
239
240
241
242
243
244
245
246
247
248
249
250
251
[English](./README.md) | [简体中文](./README_Zh.md)
# Introduction
[v8-profiler-rs](https://github.com/zhangyuang/v8-profiler-rs) is a project developed in `Rust` for intelligent online analysis of `V8 heapsnapshot` files. It helps developers using V8-based applications like `Node.js/Chrome/Deno/Electron` to better understand program memory structure and assist in locating memory leaks.
## How to start
Recommend using [Online Demo](https://v8.ssr-fc.com/), it's more convenient. Or you can start it in local.
```bash
$ git clone https://github.com/zhangyuang/v8-profiler-rs.git
$ cd v8-profiler-rs/example
$ yarn && yarn start
```
## Online Demo
We have deployed an [online website](https://v8.ssr-fc.com/) where you can upload and analyze V8 memory snapshots in real-time. We recommend using `Safari` or `Firefox` browsers, as `wasm` execution performance is significantly better than in `Chrome` .
## Default example
View default example by clicking the `Example` button on the top left corner.
The code of default example is as follows:
```js
const express = require('express');
const app = express();
const fs = require('fs')
// the memory leak code
let theThing = null;
let replaceThing = function() {
let leak = theThing;
let unused = function() {
if (leak)
console.log("hi")
};
theThing = {
bigNumber: 1,
bigArr: [],
longStr: new Array(1000000),
someMethod: function() {
console.log('a');
}
};
};
let index = 0
app.get('/leak', function closureLeak(req, res, next) {
replaceThing();
index++
if (index === 1) {
const stream = require('v8').getHeapSnapshot()
stream.pipe(fs.createWriteStream('small-closure.heapsnapshot'))
}
if (index === 40) {
const stream = require('v8').getHeapSnapshot()
stream.pipe(fs.createWriteStream('medium-closure.heapsnapshot'))
}
if (index === 50) {
const stream = require('v8').getHeapSnapshot()
stream.pipe(fs.createWriteStream('big-closure.heapsnapshot'))
}
res.send('Hello Node');
});
app.listen(3001);
```
## Analyze Report
There are two types of reports: single report and compare report.
### Single Report
```yml
Analyze Report with single
Only show nodes with more than 20 occurrences
Memory retained by constructor type
closure: 156409.05 MB
Object: 156408.32 MB
system / Context: 154881.33 MB
array: 4579.70 MB
synthetic: 1533.60 MB
Array: 1526.16 MB
WeakMap: 1526.01 MB
(compiled code): 2.96 MB
string: 2.10 MB
There are some nodes that are duplicated too many times
someMethod @70761: 202(memoryleak - demo / closure / index.js)
HttpError @95957: 44(node_modules / http - errors / index.js)
parse @89241: 33(node_modules / ms / index.js)
ClientError @50469: 31(node_modules / http - errors / index.js)
indexOf @49211: 27(node_modules / object - inspect / index.js)
send @126827: 23(node_modules / send / index.js)
resolve @98543: 23(node_modules / express / lib / view.js)
```
### Compare Report
```yml
Analyze Report with compare
Only show nodes with more than 20 occurrences
Additional nodes by constructor type
(compiled code): 242
ArrayBuffer: 127
system / JSArrayBufferData: 127
Buffer: 126
Node / std::basic_string: 78
closure: 69
Array: 46
array: 44
system / Context: 34
Object: 29
Bigger nodes by constructor type
(compiled code): 48
closure: 25
Bigger nodes by increased size
@1: +83.54 MB
Object @6613: +76.30 MB
Array @154471: +76.30 MB
Array @154499: +76.30 MB
app @6603: +76.30 MB(node_modules / .pnpm / express @4 .18 .2 / node_modules / express / lib / express.js)
router @6533: +76.30 MB(node_modules / .pnpm / express @4 .18 .2 / node_modules / express / lib / router / index.js)
closureLeak @6481: +76.30 MB(memoryleak - demo / closure / index.js)
Route @6511: +76.30 MB
Layer @6517: +76.30 MB
Layer @6497: +76.30 MB
Server @6609: +76.30 MB
system / Context @6483: +76.30 MB
```
## Implemented Features
🚀 indicates implemented features. This application is continuously being updated, and updates will be synchronized to the README.md. Please stay tuned. If this application helps you, please give it a Star ✨
| Milestone | Status |
|-----------|--------|
| Parse V8 snapshot to generate complete node information | 🚀 |
| View node source location and constructor | 🚀 |
| Generate analysis reports | 🚀 |
| Frontend visualization support | 🚀 |
| Filter nodes by ID and name | 🚀 |
| Filter number of nodes and view detailed node references | 🚀 |
| Filter reference depth and number of references | 🚀 |
| Compare two snapshot files | 🚀 |
| Support two comparison types: new nodes/increased GC size | 🚀 |
| Automatically filter non-business nodes based on node count | 🚀 |
| Support uploading local serialized JSON files | 🚀 |
| Implement `Wasm + WebWorker` parsing to avoid site unresponsiveness | 🚀 |
| Optimize parsing performance and reduce memory usage | 🚀 |
## Why Rust
Parsing V8 memory snapshots involves a lot of computational operations. CPU-intensive scenarios are inherently not JavaScript's strong suit.
After reading Chrome's official memory analysis tool source code, I found it uses many tricks to ensure performance, making the code highly complex and difficult to maintain.
Rust is perfect for this scenario, providing excellent performance while maintaining code readability. Rust's superior multi-threading capabilities are exactly what we need, as parsing computation logic is ideal for multi-threaded optimization. We will continue optimizing computational performance in future versions.
This application's approach can be applied to any programming language with GC. We will strive to support memory analysis for more programming languages in the future.
Finally, Rust's official WebAssembly support is excellent, allowing us to easily compile Rust code to WebAssembly for browser use.
## Handling Parse Timeout Issues
For very large files, you may encounter Wasm memory overflow or long parse times. If this occurs, try using `Safari` or `Firefox` browsers.
## Contact
The prohect has been updating, if you have any questions or suggestions, please submit an [issue](https://github.com/zhangyuang/v8-profiler-rs/issues)
<div style="display:flex">
<img src="https://res.wx.qq.com/op_res/Nv12X2und927FEOvJ5iflzX-WBW07GSC22kumTCiShZnudKpG0jMuRs70ecHQb3Hy1QjjaASNzyOuMgHr43Wpw" width="300">
### How to sponsor me
There are two ways to sponsor me both Alipay and WeChat
Eth address: 0x87a2575a5d4dbD5f965e3e3a3d20641BC9a5d192
<div style="display:flex">
<img src="https://res.wx.qq.com/shop/public/2025-02-12/d50454c8-65f0-4a81-956b-b8837c187364.jpg" width=200>
<img src="https://res.wx.qq.com/op_res/9jSx7WJn6FBlfQ0ColL4hnvX91D9MlB_XPCgLFM527qknHp0utXZkLah6MYcumdVejK4884dvgkY0NIbBLPrYg" width=200>
</div>
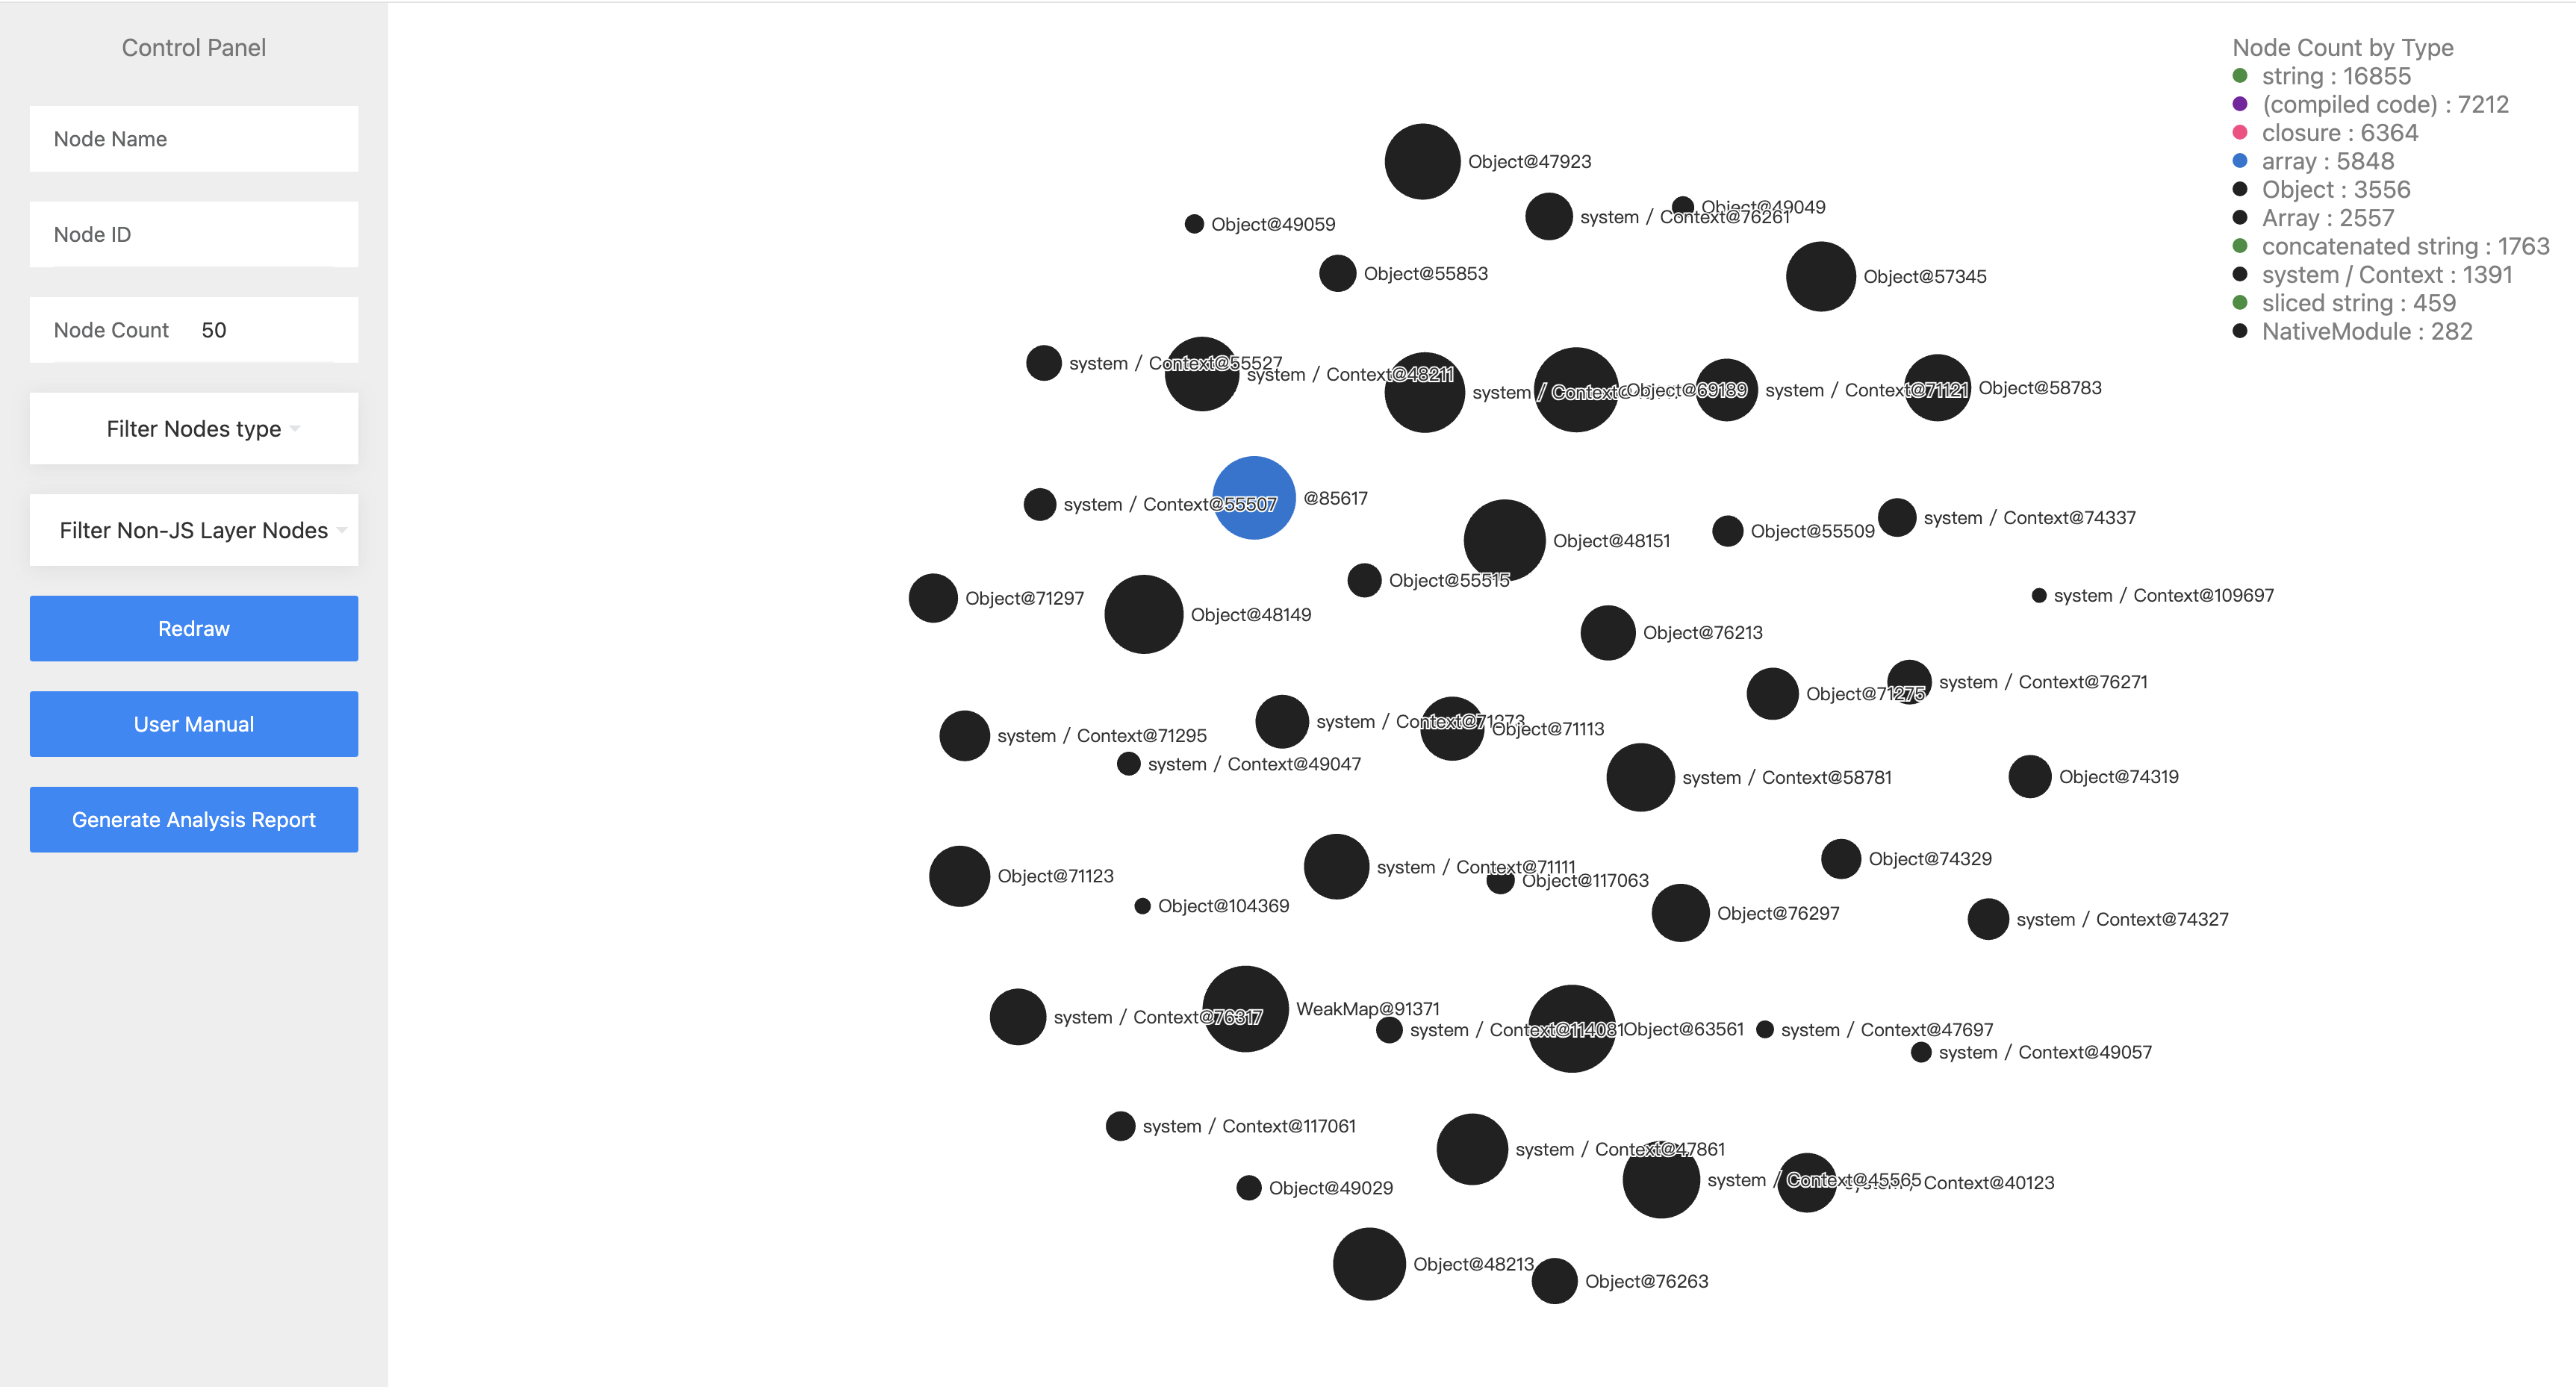
## How to use
Open the [online demo](https://v8.ssr-fc.com/) and upload the `heapsnapshot` file. You can upload one or two files for comparison.
There will render heapsnapshot nodes in web page.
The node fields are as follows:
```js
{
"node_type": string; // node type
"name": string; // node name
"id": number; // node id
"size": number; // node self size
"edge_count": number; // node edge count
"retained_size": number; // node retained size, the free size of the node after GC
"pt": number; // the ratio of self size / retained size
"edges": {
"edge_type": string; // edge type
"to_node": number; // the id of the node that the edge points to
"name_or_index": string; // the name or index(for array) of the edge
} [];
"source": string; // the source file of the node
"constructor": string; // the constructor of the node
"percent": string; // the retained size ratio of the node
}
```